Recent issues
Vol. 7, Issue 3: Gross Domestic Product Trends – February 23, 2026 (PDF)
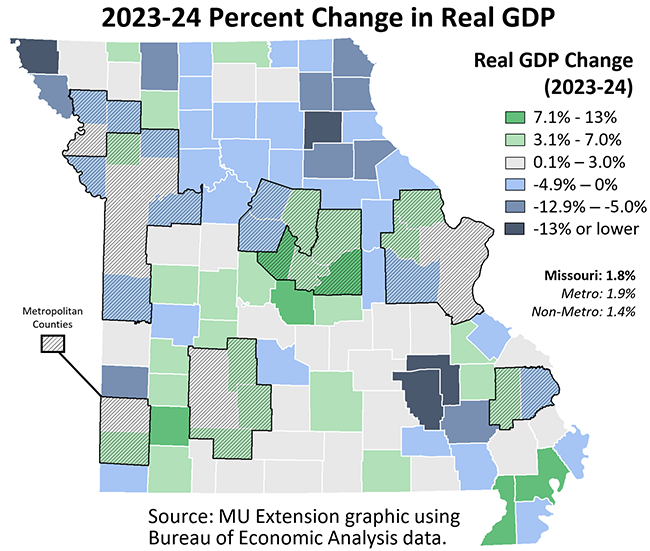
Missouri’s real GDP expanded by 6.6% from 2021 to 2024. Growth was led by the state’s metro areas. Nonmetro Missouri areas, however, did see faster 2021-24 GDP growth in health care and professional and business services. Roughly 59% of Missouri counties grew their economies from 2023 to 2024, compared to 74% of U.S. counties.
Vol. 7, Issue 2: Commuting Across Counties – February 2, 2026 (PDF)
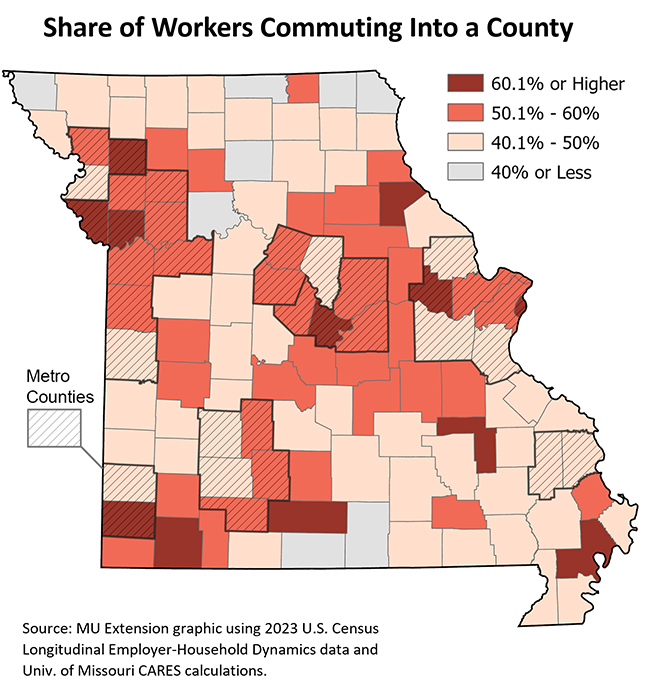
Four in 10 Missouri payroll jobs were filled by out-of-county workers in 2003. By 2023, it was over half of all jobs. Nonmetro commuters travel an average of 28 miles one-way to work, compared to 16 miles for urban commuters. Missouri’s high level of commuting reinforces the need to “think regionally” when considering economic and workforce development strategies.
Vol. 7, Issue 1: Artificial Intelligence and Job Postings – January 12, 2026 (PDF)
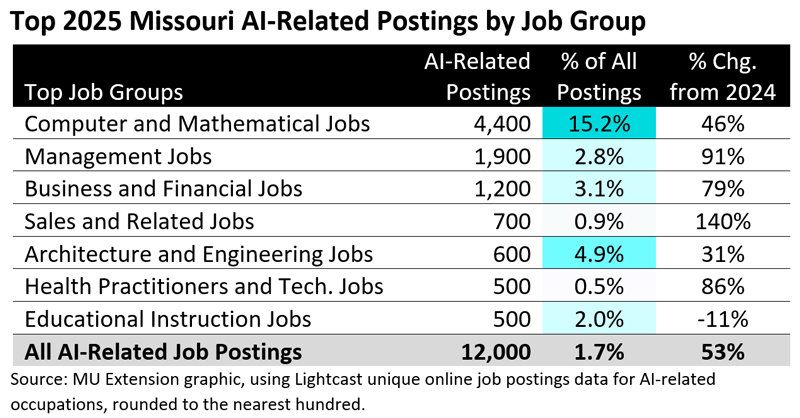
December 2025 BTOS data reveals that 18.5% of Missouri businesses currently use AI, slightly outpacing the U.S. (17.8%). AI-related job postings grew 53% from 2024 to 2025, far outpacing the 10% increase in overall postings. Although job ads do not directly translate into hires, the growth signals rapidly rising demand for AI skills.